Traffic Challan Statistics in India- Trends, Records & Patterns

Updated on: 3rd May, 2024 IST
In a progressively urbanised world, increased road traffic has become a trademark of modern civilisation. With more vehicles on the road, there are more instances of traffic rule violations and issuing of fines. This has resulted in a large amount of data that can provide valuable insights into various trends and patterns.
To make roads safer and manage traffic better, examining traffic challan data becomes important. By understanding the main types of violations, the reasons behind them, and the factors contributing to their repetition, this article aims to uncover valuable information on the way people commute and traffic is managed.
Table of Contents
- Traffic Challan Statistics: Key Metrics
- Total Number of Challans Issued Annually
- Most Common Types of Violations Recorded
- Time-Based Patterns in Challan Issuance
- Vehicle Type and Violations
- Demographics and Challan Statistics
- Seasonal Variations in Challan Rates
- Influential Factors in Challan Issuance
- Trend Analysis: Yearly Comparisons
- Challan Payment Patterns
- Impact of Challans on Road Safety
- Conclusion
- FAQ
Traffic Challan Statistics: Key Metrics
Traffic violation fines, also known as traffic challans, are fines issued by traffic authorities on drivers who violate road regulations. These penalties play a major role in improving road safety. Below are some important key metrics used to measure traffic challan statistics:
1. Total Challans Issued
This fundamental indicator provides a snapshot of the total number of road rule violations occurring within a specific time frame.
2. Violation-Specific Challans
This categorises the total challans based on the kind of violation committed, such as speeding, driving while drunk, or failure to wear a seatbelt.
3. Geographic Distribution of Challans
This data point identifies the locations with the highest incidence of traffic violations, which can guide targeted law enforcement actions.
4. Average Penalty Amount
This measures the average monetary value of fines collected for traffic offences.
5. Rate of Fine Payment
This shows the proportion of motorists who settle their traffic fines, with a high rate suggesting that drivers are generally knowledgeable and willing to follow traffic laws.
5. Incident Rate
This reveals the number of traffic accidents within a specific time frame, providing insight into the relationship between traffic violations and road safety.
Although these are some primary indicators, the most relevant metrics will differ based on the objectives of the traffic enforcement agency.
Here are some other things to keep in mind while interpreting traffic challan statistics:
- The total count of issued challans may not fully represent the actual number of traffic violations, as some offenders may evade capture or pay their fines without acknowledging guilt.
- The average penalty sum can fluctuate based on the gravity of the offence and local regulations.
- The rate of fine payment can be influenced by multiple variables, including the public's perception of fine fairness and available methods of payment.
- The correlation between the incident rate and the total number of traffic violations is not necessarily straightforward, as other factors like weather conditions and driver distraction can also be influential.
- Despite these caveats, traffic challan data remains a useful resource for gaining insights into road safety and evaluating the success of law enforcement initiatives.
Total Number of Challans Issued Annually
The annual tally of traffic challans in India fluctuates each year. According to the latest statistics, in 2022, authorities handed out over 4.73 crore challans with a total value of ₹7,563.60 crore for traffic offences nationwide. This marks a substantial rise compared to 2021, when fines for traffic violations across the country amounted to ₹1,898.73 crore.
This escalation in the number of challans can be traced back to several contributing factors:
1. The enactment of the Motor Vehicles (Amendment) Act in 2019, which heightened the financial penalties for breaking road rules.
2. The growing adoption of automated law enforcement technologies, such as speed and red light cameras.
It's worth noting that we can expect the number of issued challans to keep rising in the foreseeable future. This is due to both traffic law enforcement agencies ramping up their efforts and the increasing ubiquity of automated enforcement systems. This trend is growing at a rapid rate since it has the potential to decrease the rate of traffic accidents and enhance road safety overall.
Also Read: How Does Fake E-Challan Scam Works in India?
Most Common Types of Violations Recorded
Below given is the curated list of the most common types of violations-
1. Speeding
Exceeding the designated speed limit is a violation of traffic regulations aimed at safeguarding lives. The National Highway Traffic Safety Administration (NHTSA) stated that in 2021, speeding took the lives of 12,330 individuals.
2. Driving Under the Influence
A CDC report shows that each year, intoxicated driving is responsible for more than 10,000 deaths.
3. Reckless Driving
Actions like failing to signal turns, sudden braking, and other reckless behaviours contribute to accidents. Reckless driving is responsible for about one-third of fatal accidents, according to Driver Knowledge.
4. Distracted Driving
Engaging in activities like texting, talking on the phone, or adjusting the radio while driving constitutes distracted driving. This resulted in 3,522 deaths in 2021, according to NHTSA.
5. Running a Red Light
A 2019 report from AAA revealed that running red lights led to 939 fatalities in 2017, setting a record for the highest number in a decade.
Geographical Distribution of Challans
The distribution of challans for traffic violations across India varies by state. Some states, like Uttar Pradesh, Maharashtra, Delhi, Karnataka, and Tamil Nadu, record higher numbers of issued challans.
These states have big cities, with dense traffic contributing to more challans. On the other hand, states in the northeast, like Sikkim, Meghalaya, Mizoram, Arunachal Pradesh, and Nagaland, report lower numbers of challans due to lighter traffic and potentially less strict traffic rules.
The geographical variation in challan distribution can also be influenced by factors like how strictly traffic laws are enforced, the availability of public transport, and public awareness of traffic rules.
States that rigorously enforce traffic laws tend to have more challans. While places with good public transportation options usually see fewer challans since people prefer public transport over driving. Higher awareness of traffic rules also leads to fewer violations and, as a result, fewer challans.
Also Read: Understanding Different Types of Traffic Challans
Time-Based Patterns in Challan Issuance
Challan issuance patterns based on time can display variations depending on the country or region. Nonetheless, there are several overarching trends that can be noted:
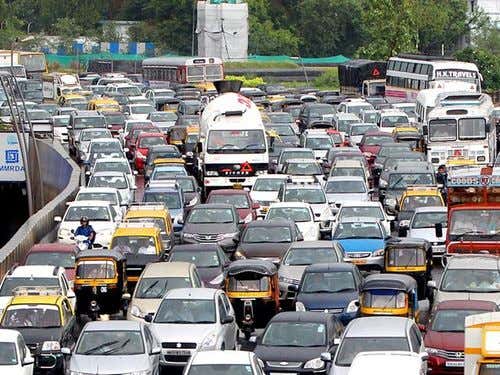
1. Peak Traffic Hours
Challans are more prone to be issued during peak traffic hours, typically the morning and evening rush hours. This is primarily due to the heightened vehicle presence during these periods, creating more opportunities for traffic violations.
2. Nighttime
Challans are also more likely during nighttime when visibility is reduced. Reduced visibility makes it challenging for drivers to perceive traffic signs and signals, increasing the likelihood of rule violations.
3. Weekends
Weekends see a surge in challan issuance as more people take to the roads, leading to increased traffic congestion and potential violations.
4. Holidays
Challans also tend to spike on holidays when a higher volume of drivers line up in congested roadways. Special occasions like festivals or sports events may even witness more frequent challan issuance due to increased road usage.
It's essential to recognise that these are just a few contributing factors to challan issuance. The specific factors influencing a particular case can vary according to the situation.
Vehicle Type and Violations
Take a glance at the table provided below to grasp the fines imposed on vehicles for violating various traffic regulations-
| Violations | Vehicle Type | Maximum Amount of Fine |
| Allowing a person without licence to drive your vehicle | Car & 2-Wheeler | ₹1000 |
| Vehicle driven by minor (below 18 years of age) | Car & 2-Wheeler | ₹500 |
| Reckless or negligent driving | Car & 2-Wheeler | ₹1,000 |
| Driving without seat belts | Car | ₹1,000 |
| Driving without helmet | 2-Wheeler | ₹1,000 & Scrapping of licence for 3 Months |
| Hazardous driving or riding over the speed limit | Car & 2-Wheeler | ₹1,000 or Imprisonment for up to 6 months |
| Driving against one-way | Car & 2-Wheeler | ₹100 |
| Reversing without caution | Car & 2-Wheeler | ₹100 |
| Not keeping the vehicle to the left side of the road while driving | Car & 2-Wheeler | ₹100 |
| Tripling on two-wheeler | 2-Wheeler | ₹100 |
| Driving on footpath | Car & 2-Wheeler | ₹100 |
| Intentional disobeying of lawful directions | Car & 2-Wheeler | ₹500 |
| Driving under the influence of drugs/alcohol/ any other intoxicating substances | Car & 2-Wheeler | ₹10,000 or Imprisonment for up to 6 months |
| Mobile usage while driving | Car & 2-Wheeler | ₹1,000 |
| Road accident involving a minor | Car & 2-Wheeler | ₹1,000 |
| Not giving way to emergency vehicle | Car & 2-Wheeler | ₹10,000 |
| Driving the vehicle with offensive number plates | Car & 2-Wheeler | ₹100 |
| Displaying number plate as ‘applied for’ | Car & 2-Wheeler | ₹4,500 |
| Improper horn usage | Car & 2-Wheeler | ₹100 |
| Driving without horn | Car & 2-Wheeler | ₹100 |
| Improper usage of vehicle lights | Car & 2-Wheeler | ₹100 |
| Using a high beam when it’s not neededDisobeying sign board | Car & 2-Wheeler | ₹100 |
| Jumping signal | Car & 2-Wheeler | ₹1,000 & Scrapping of licence for 3 Months |
| Not giving a signal while taking a turn | Car & 2-Wheeler | ₹100 |
Demographics and Challan Statistics
You’ll be shocked to know that the number of challans issued in India has been going up frequently in the past few years. As of July 2023, over 6.4 million challan fines have already been gathered, surpassing more than half of the total fine amount of Rs 11.1 crore collected throughout 2022.
This growth could be because there are more automobiles on the roads now, technology is being used more to impose traffic rules, and more people in India are becoming conscious of how essential it is to follow traffic laws for safety.
Secondly, the different types of people getting challans are also modified. In previous times, more challans were given to young men. But recently, more women and older individuals have been receiving challans. This is probably because these groups are driving more than they used to.
Lastly, the purpose for giving out challans is also changing. In the past, most challans were given for things like driving too fast or recklessly. But in recent years, more and more challans are being issued for things like not having the right pollution control documents.
Here are some specific statistics about the challans given in India-
1. In 2023, the most common reason people got challans was for violating red light. This made up more than 43% of all challans. People also got challans for things like not wearing a helmet, driving without a licence, and driving after drinking alcohol.
2. In 2023, the states where the most challans are given are Uttar Pradesh, Maharashtra, and Tamil Nadu.
3. The cities with the highest numbers of challans in 2023 are Delhi, Mumbai, and Bengaluru.
These numbers show that it's imperative to keep instructing people about following traffic rules in India. If more people know about traffic safety and the rules are followed, it can help to make the roads safer and bring down the number of accidents and deaths.
Seasonal Variations in Challan Rates
Seasonal variations in challan rates do not show any solid evidence. However, specific factors can lead to alterations in the number of challans imposed during certain times of the year.
For instance, during the holiday season, when road traffic is higher, there might be an uptick in challan issuance. Similarly, warmer months, like summer, could see an increase in challans due to more people being out on the roads.
However, it's also possible that the frequency of challan issuance remains fairly constant throughout the year. This is because the elements that affect the issuance of challans, like the nature of the violation and the location where it happened, are unlikely to undergo major modifications from one season to another.
Influential Factors in Challan Issuance
The issuance of challans for traffic violations is determined by a variety of factors.
Some of the key influential attributes include-
1. Type of Violation
The nature of the traffic violation is an important factor in determining whether a challan will be issued or not. Severe violations, such as reckless driving, overspeeding, and driving under the influence, are more likely to result in challan issuance.
2. Location
The geographic location of the violation can affect the possibility of receiving a challan. Specific areas, like school zones or busy intersections, may have severe impositions to ensure the welfare of pedestrians and other road users.
3. Evidence
The accessibility of proof, such as videos, photographs, or eyewitness accounts, can strongly affect whether a challan is issued. Solid proof of the violation intensifies the case for enforcement.
4. Repeat Offenders
Law imposition often keeps track of repeat lawbreakers. If a person has a history of traffic violations, they might be more likely to receive a challan for repeated offences.
Trend Analysis: Yearly Comparisons
In 2022, organisations disclosed over 4.7 crore challans, equivalent to ₹7,563.6 crore, for different traffic violations nationwide. In 2021, more than 4.21 crore challans were disclosed, amounting ₹5,318.7 crore.
Regarding the returns earned from these challans, the year 2022 saw a collection of ₹2,874.4 crore, while the outstanding amount reached ₹4,654.3 crore. As of March 31, 2023, the country has recorded over 6.1 crore vehicles aged 15 years or more.
In terms of registered vehicles (15 years or more), Karnataka leads with 8.7 million, followed by Uttar Pradesh with 7.4 million, and Delhi with 5.7 million, as per the information provided by the minister, Nitin Gadkari.
Challan Payment Patterns
There are generally two modes of payment for challan-
1. Online Mode
When making payments online, there are two distinct e-challan methods available—online and offline.
Pay your challan on CARS24
- Visit the CARS24 eChallan section
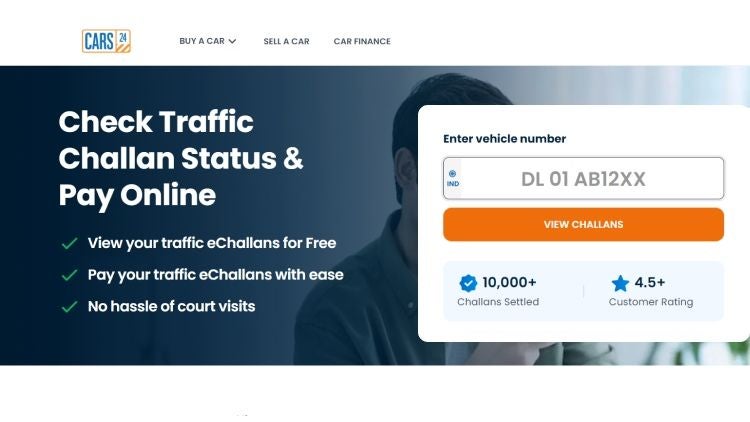
- Enter your vehicle number
- Any pending challans associated with your vehicle will be displayed
- Find the challan you want to pay, and click on the “Pay Now” button, which is displayed under every pending challan
- And that’s it! CARS24 takes care of settling the challans on your behalf
- You will receive a notification from CARS24 once the settlement is completed
To Pay Your E-Challan on the Parivahan website, Follow These Steps-
- Step 1. Visit the official website at: echallan.parivahan.gov.in.
- Step 2. Choose between Challan Number, Vehicle Number, or DL Number.
- Step 3. After selecting the appropriate option, input the captcha code.
- Step 4. Click "get details" upon the captcha entry.
- Step 5. Following this, opt for your preferred payment method.
- Step 6. After reviewing the challan-related information, select ‘Pay Now’ to initiate payment.
Upon successful payment, you will receive an online receipt for your e-challan payment.
B. Offline Mode
To Pay Offline Challan, Follow These Steps-
Step 1. Visit your nearest Police Station
Locate the nearest police station to where you received the challan. Don't forget to carry your Driving Licence, proof of address and identity, along with the traffic violation challan handed to you by the traffic police. At the station, you can settle the payment using either cash or a card, and they'll hand you a receipt as proof of your visit.
Step 2. Pay through the traffic police officer
Alternatively, spot a traffic police officer with an e-challan machine. Display your Driving Licence, ID proof, and the challan. Settle the fine with cash or card, and pocket your receipt.
Also Read: How to Check the Accident History of a Vehicle in India
Impact of Challans on Road Safety
The influence of traffic challans on road safety is a multifaceted issue that defies simplistic solutions. In India, the implementation of the Motor Vehicles (Amendment) Act in September 2019 significantly escalated the penalties for traffic violations, with the intention of discouraging such behaviour and elevating road safety standards.
Some data does point to the effectiveness of these steeper fines in enhancing road safety. For instance, road accidents in India declined by 18% in 2020, the initial year in which augmented fines were enforced. Yet, it remains challenging to attribute this decline solely to the heightened penalties, especially considering other variables like the COVID-19 pandemic, which also reduced road traffic.
It's crucial to acknowledge that challans are not a silver bullet for ensuring road safety. Despite the risk of hefty fines, numerous individuals continue to flout traffic laws, either because they think they won't be caught or due to a lack of concern for the well-being of others.
The actual impact of challans on road safety is likely contingent on various factors, including the scale of the fines, the rigour of law enforcement, and the general mindset of drivers. Nonetheless, when paired with other strategies, challans could serve as a potent tool for bettering road safety.
Additional Strategies for Road Safety Improvement:
- Driver Education: Educating drivers about the significance of obeying traffic laws and the ramifications of violations can go a long way.
- Infrastructure Upgrades: Roads should be designed for both safety and efficiency, and suitable facilities should be available for pedestrians and cyclists.
- Consistent Law Enforcement: Traffic regulations must be implemented in a consistent and fair manner.
- Public Awareness Efforts: Campaigns that raise awareness about road safety can further educate the populace about its importance.
- By collectively employing these methods, we can make a concerted effort to enhance the safety of our roads.
Also Read: Know the Indian Road Safety Rules
Conclusion
Delving into the realm of traffic challan data reveals a tapestry of insights that can significantly impact road safety and urban planning. By deciphering the trends and patterns hidden within this data, authorities can make informed decisions to enhance traffic management, prioritise infrastructural improvements, and design targeted awareness campaigns.
Moreover, this analytical approach underscores the pivotal role of technology in shaping modern societies, where harnessing the power of data not only facilitates smarter governance but also fosters a culture of responsible and law-abiding citizens. As we move forward, the fusion of data-driven strategies and proactive measures promises a future where streets are safer, commutes are smoother, and cities thrive as connected, secure, and vibrant hubs of life.
FAQ
Q. What are traffic challan statistics?
Traffic challan stats are basically numbers and info about traffic rule breakers and the fines they get. These numbers help us see how safe our roads are, how good the cops are at catching rule breakers, and how drivers generally behave out there.
Q. How are these statistics collected?
Traffic challan statistics are collected through an integration of manual and automated procedures. Law enforcement officers manually investigate and record violations, issuing physical tickets with details of the violation, time, date, and location. Electronic ticketing systems permit officers to input violation data into handheld devices, producing digital tickets that are shifted to a central database.
Q. How can traffic challan statistics improve road safety?
Traffic challan statistics help make our roads safer by identifying risky spots, guiding what the authorities should focus on, discouraging bad driving, helping plan traffic better, and educating drivers. These stats help make sure efforts and resources go where they're needed most, show if current rules are working, and encourage people to drive responsibly by keeping them in the loop.
Q. What role does technology play in gathering and analysing statistics?
Technology is super important for improving how we handle traffic challan statistics. It automates the boring stuff like collecting data through cameras and other gadgets. This data then gets stored in one place, making it easier to spot trends and patterns. Plus, it allows for real-time monitoring and better communication with the public, all aimed at making our roads safer.
Recently Added Cars to Buy


Other Blogs
- Recent
- Featured
How to Renew Driving Licence in Dadra and Nagar Haveli?
Updated on: 3rd May, 2024 IST

Upcoming Hyundai Cars in India 2023 - Expected Price with Features & Specs
Updated on: 3rd May, 2024 IST

Safest Cars Under ₹10 Lakh in India in 2024
Updated on: 3rd May, 2024 IST

What is Demo Car and How to Buy Test Drive Cars in India
Updated on: 3rd May, 2024 IST
Check E-Challan Status Online & Pay Traffic Challan in Mumbai – CARS24
Updated on: 3rd May, 2024 IST
Driving Licence Status Online in Gujarat – DL Application Status in Gujarat
Updated on: 3rd May, 2024 IST
Driving Licence Fees Online in Kerala – DL Application Fees in Kerala
Updated on: 3rd May, 2024 IST

9 Best Mahindra SUV in India in 2024 – Price, Mileage, Specifications
Updated on: 3rd May, 2024 IST
Follow These 5 Essential Tips To Drive Through Floods
Updated on: 3rd May, 2024 IST


Popular Cities to Sell Car


