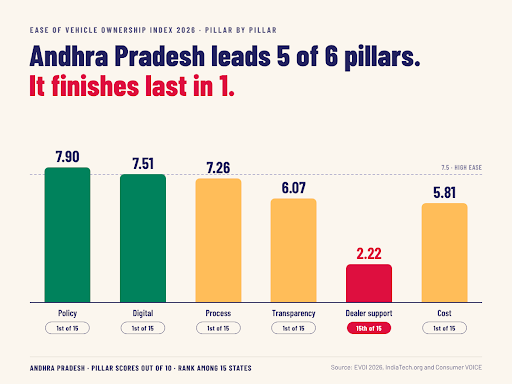
EVOI 2026, Pillar by Pillar Comparison & Scores: Andhra Pradesh Leads 5 of 6 Pillars and Finishes Last in 1: EVOI 2026
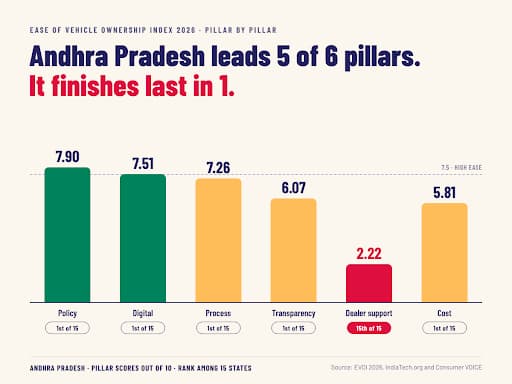
- 1Andhra Pradesh tops five of six EVOI 2026 pillars but ranks last in dealer support
- 2Cost and affordability is the weakest pillar, averaging just 2.61 across 15 states
- 3Karnataka balanced its scorecard, with smallest gap between best and worst pillars
- Six Pillars, Weighted 10% to 20%: How to Read an EVOI Scorecard
- Policy and Regulation: A 4.5x Gap Between Andhra Pradesh (7.90) and Bihar (1.77)
- Digital Infrastructure: The Highest Average (5.12), Yet 13 of 15 States Still Want Paper
- Process Efficiency: Delhi Drops 3.34 Points From Digital to Delivery
- Transparency: West Bengal Ranks 3rd Here, 13th Overall
- Dealer Support: Rajasthan at 7.32, Andhra Pradesh at 2.22
- Cost and Affordability: Average 2.61, the Index's Lowest
- Balanced vs Lopsided: Karnataka's 1.39-Point Spread vs Andhra Pradesh's 5.68
- Digital 5.12, Process 4.43, Cost 2.61: Where the System Breaks
Same car, different state, different month. Sell a used car in Andhra Pradesh and the RC moves into the buyer's name in 7 to 10 days. In Uttar Pradesh, you'll still be waiting after a month.
The Ease of Vehicle Ownership Index (EVOI) 2026 gives each of 15 states six pillar scores, and those 90 numbers tell a stranger story than the headline ranking. Andhra Pradesh tops five pillars. In the sixth, it comes dead last.
Cost scores worst in 12 of the 15 states. Karnataka tops nothing. (Not one pillar.) It still finishes fifth, for a reason worth stealing.
Six Pillars, Weighted 10% to 20%: How to Read an EVOI Scorecard

EVOI 2026 scores each state out of 10 on six pillars. These pillars include policy, digital infrastructure and process efficiency at 20% each, dealer support and cost at 15% each, and transparency at 10%. Then a weighted geometric mean multiplies the six together instead of adding them.
That choice punishes lopsided states. A weak pillar costs far more than a strong one earns. Andhra Pradesh's weighted pillars add up to 6.35, but multiplication pulls its index down to 5.91, and nearly all of the 0.43-point loss comes from a single 2.22 on dealer support. The report then sorts scores into four bands. Firstly, high ease, where scores are above 7.5, moderate ease, from 5 to 7.5, limited from 4 to 5 and poor below 4.
| Pillar | Weight | 15-state average | Highest | Lowest |
| Policy and Regulatory Framework | 20% | 4.48 | Andhra Pradesh (7.90) | Bihar (1.77) |
| Digital Infrastructure and Services | 20% | 5.12 | Andhra Pradesh (7.51) | West Bengal (1.98) |
| Process Efficiency and Timeliness | 20% | 4.43 | Andhra Pradesh (7.26) | Uttar Pradesh (2.76) |
| Transparency and Accountability | 10% | 4.39 | Andhra Pradesh (6.07) | Rajasthan (2.52) |
| Institutional Ecosystem and Dealer Support | 15% | 4.24 | Rajasthan (7.32) | Andhra Pradesh (2.22) |
| Cost and Affordability | 15% | 2.61 | Andhra Pradesh (5.81) | Uttar Pradesh (0.56) |
Pillar scores from EVOI 2026. Averages are a simple mean of the 15 state scores.
Only digital clears 5 on average. Cost manages 2.61.
Policy and Regulation: A 4.5x Gap Between Andhra Pradesh (7.90) and Bihar (1.77)
There is a wide variance in scores across the states as per the report’s scoring mechanism. Andhra Pradesh scores 7.90. Bihar scores 1.77. That's more than a full point below Uttar Pradesh, and the 6.13-point spread from first to last is the widest of any pillar.
The pillar checks how far each state strays from the central rules, and an insight that has emerged is that road tax is its weakest spot nationally. Five states score below 4.0 on it. Telangana rides a refund that actually pays out to second place, at 5.61. The strays are oddly specific.
Punjab requires a Tehsildar-attested photo affidavit from the buyer, while Karnataka insists on the physical Master File from the car's first registration. This is equivivallent to the government's version of digging out your Class 10 marksheet. Rajasthan goes furthest. If you rent, it wants your agreement registered with the Collector, plus stamp duty, photographs and thumb impressions, so the notarised one in your drawer won't do. None of this is in the Central Motor Vehicles Rules.
Digital Infrastructure: The Highest Average (5.12), Yet 13 of 15 States Still Want Paper
Digital infrastructure is EVOI 2026's strongest pillar, averaging 5.12 across 15 states. Andhra Pradesh scored 7.51 and Kerala 7.02 out in front. Yet 13 of those 15 states still make applicants hand over physical copies after filing online.
The report calls it dual submission: the applicant files online, then delivers the same papers to the RTO in hard copy, so the portal adds a step instead of removing one. Plenty of sellers treat a submitted form as a finished transfer. It isn't. Outside Andhra Pradesh, Kerala, Delhi and Madhya Pradesh, RTO staff still insist on physical originals over DigiLocker or mParivahan records, and that refusal is the pillar's widest gap between states.
Punjab ranks fourth on digital at 6.35, yet the launch presentation says couriering physical papers stays mandatory there after an online application. West Bengal sits last at 1.98, and Telangana, at 4.21, only began integrating with VAHAN in March 2026. Paper still wins.
Process Efficiency: Delhi Drops 3.34 Points From Digital to Delivery
A good portal doesn't move a car any faster. Delhi proves it. The capital scores 6.81 on digital and 3.47 on process, a 3.34-point fall no other state comes close to.
You're probably picturing a slow clerk. The report points at the seller instead, who has to share an OTP at the right moment, and at signature mismatches that need fixing before anything moves. Transfers there take 20 to 25 days.
Telangana runs the other way. A modest 4.21 on digital, yet second on process at 5.84, because a mandatory slot-booking system controls how many applications reach the RTO. Boring? Sure. It's also the easiest fix here to copy.
Uttar Pradesh, last here at 2.76, wants an inter-RTO NOC every time a car moves between two of its own RTOs. Bihar's DTO signs files in monthly batches, so miss one and you wait for the next.
Transparency: West Bengal Ranks 3rd Here, 13th Overall
West Bengal scores 5.80 on transparency and accountability, third of 15 states, even though it ranks 13th in EVOI 2026. Its real-time tracking shows an application's status at every stage, and only Andhra Pradesh, at 6.07, and Gujarat, at 6.03, score higher on the pillar.
The pillar carries just 10% of the weight. It scores three indicators: tracking, information access and grievance redressal. Tracking is the strongest in most states. Grievance redressal is the weakest by far, and Andhra Pradesh is the only state with a system that functions. With no public rulebook to check, dealers learn about a rule change when an application bounces, and in Gujarat, Maharashtra, Madhya Pradesh and several other states the news arrives on WhatsApp.
Rules arrive by rejection. In Rajasthan, which comes last at 2.52, they also change with the officer in charge across its 60 RTOs. "When a new officer comes, he may change rules, and you have to adjust accordingly," one respondent there said.
Dealer Support: Rajasthan at 7.32, Andhra Pradesh at 2.22

Andhra Pradesh tops every pillar but this one, and here it comes dead last.
The pillar has two halves. Buyer protection holds up. Dealer registration doesn't.
Registration matters because of deemed ownership, the 2022 rule that treats an Authorised Dealer of Registered Vehicles (ADRV) as the owner of any car in its stock, so the seller stops collecting its fines.
Kerala has 875 ADRVs, the most of any state, and Rajasthan 261. Andhra Pradesh has three, Telangana none.
Even Rajasthan, top of the pillar at 7.32, wobbles. One respondent said officers who didn't know the rules had impounded dealer cars in two or three places. (In the best-scoring state.) Run a small lot below the GST turnover threshold and you can't become an ADRV, so every car you buy stays in the seller's name, and on their challan record, until the RTO catches up. Don't read the pillar as a head count. Delhi scores 5.40 with zero ADRVs, and West Bengal has 332 yet scores 2.89.
Cost and Affordability: Average 2.61, the Index's Lowest

Cost averages 2.61 out of 10, the lowest of the six pillars, and 12 states score worse on it than on anything else in their scorecards. Only Kerala and Andhra Pradesh clear 5, at 5.25 and 5.81, while Uttar Pradesh's 0.56 is the lowest score anywhere in the index.
A low score doesn't mean an expensive transfer. The pillar measures how far the real bill strays from the official fee, which is why West Bengal scores 1.00 with an all-in cost of ₹2,000 to ₹4,000, at the cheap end of the study. Cheap, yet second from bottom. Respondents there blame manual identity checks that pad agent fees.
At Tamil Nadu's border RTOs in Hosur and Krishnagiri, an official fee of about ₹800 becomes a bill of ₹7,000 to ₹8,000. Roughly ₹9 of every ₹10 a buyer pays there goes to someone other than the state. Bihar's Muzaffarpur sets the record at ₹13,000 to ₹14,000 for one transfer.
Balanced vs Lopsided: Karnataka's 1.39-Point Spread vs Andhra Pradesh's 5.68
Karnataka is the most boring state in the index. That's a compliment.
Take each state's best pillar and subtract its worst. Karnataka's gap is 1.39, the smallest of all. It tops no pillar and its worst is 3.75 on cost, so the geometric mean takes just 0.04 points off, while Gujarat loses 0.27 and drops behind it to sixth. Boring wins.
| State (overall rank) | Strongest pillar | Weakest pillar | Spread | Points lost to geometric mean |
| Karnataka (5) | Policy (5.14) | Cost (3.75) | 1.39 | 0.04 |
| Kerala (2) | Digital (7.02) | Transparency (4.86) | 2.16 | 0.05 |
| Tamil Nadu (3) | Digital (5.43) | Cost (3.13) | 2.30 | 0.07 |
| Haryana (12) | Transparency (4.98) | Cost (1.94) | 3.04 | 0.17 |
| Maharashtra (8) | Digital (5.21) | Cost (1.94) | 3.27 | 0.19 |
| Telangana (9) | Process (5.84) | Cost (2.50) | 3.34 | 0.21 |
| Uttar Pradesh (15) | Digital (3.94) | Cost (0.56) | 3.38 | 0.37 |
| Delhi (4) | Digital (6.81) | Cost (3.31) | 3.50 | 0.16 |
| Bihar (14) | Transparency (4.70) | Cost (1.13) | 3.57 | 0.23 |
| Madhya Pradesh (7) | Digital (6.23) | Cost (2.19) | 4.04 | 0.21 |
| Gujarat (6) | Transparency (6.03) | Cost (1.81) | 4.22 | 0.27 |
| Punjab (10) | Digital (6.35) | Cost (1.94) | 4.41 | 0.27 |
| Rajasthan (11) | Dealer support (7.32) | Transparency (2.52) | 4.80 | 0.22 |
| West Bengal (13) | Transparency (5.80) | Cost (1.00) | 4.80 | 0.29 |
| Andhra Pradesh (1) | Policy (7.90) | Dealer support (2.22) | 5.68 | 0.43 |
Our analysis of EVOI 2026 pillar scores, sorted from most to least balanced. Points lost = the simple weighted average minus the geometric-mean score.
Andhra Pradesh is the class topper who aces five papers and flunks the practical. Its 5.68 spread is the widest, and its 0.43 penalty the biggest.
Fix the worst pillar first.
Lifting a 1.00 to 3.00 on cost does nearly six times more for a state's score than nudging a 6 to a 7 on policy.
Digital 5.12, Process 4.43, Cost 2.61: Where the System Breaks
EVOI 2026's pillar averages show where the system breaks. Digital infrastructure averages 5.12, process efficiency 4.43 and cost 2.61, so most states have built the portal but not the process behind it, and the time and money leak out after the online form goes in.
Delhi's 6.81 portal over a 3.47 process is one version of that gap, and Uttar Pradesh's 0.56 on cost, built on agent fees, is the other. The companion piece on the nine structural problems EVOI 2026 found traces both to their causes, and the launch report carries the full ranking. Every state has the portal. Thirteen still want the paper.
Frequently Asked Questions
Expand all